Liberal MP Hepfner may have to duke it out with NDP MPP Monique Taylor in ‘progressive bellwether’ riding of Hamilton Mountain in 2025, say Liberal and NDP insiders NewsBY ABBAS RANA
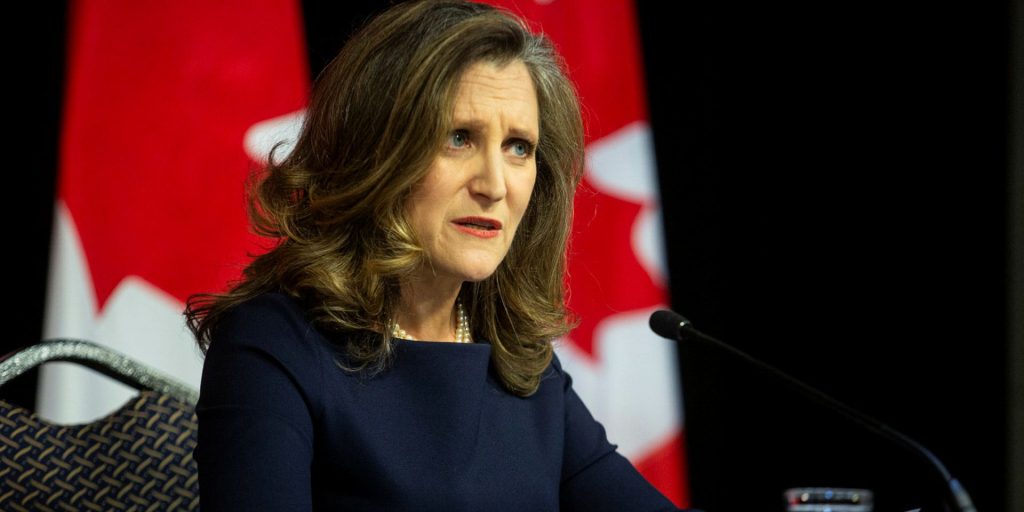
Conservatives ‘riding the stronger horse’ in competing narratives about budget: pollster Lyle NewsBY IAN CAMPBELL
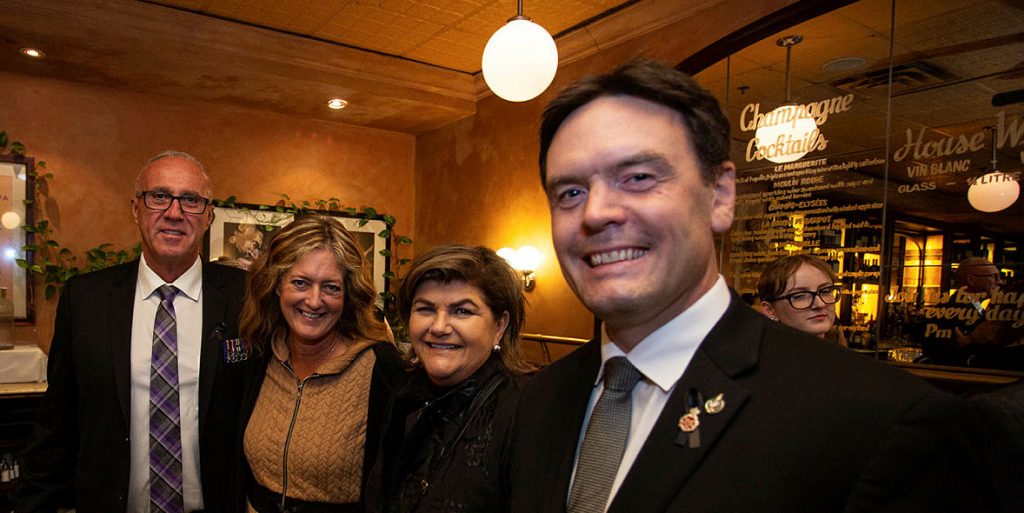
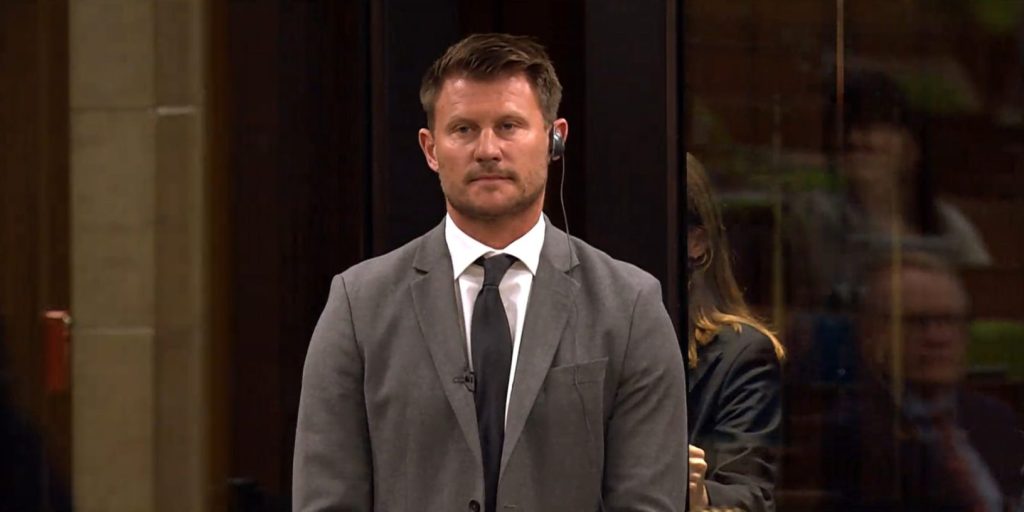
ArriveCan contractor admits ‘mistakes,’ faces historic public rebuke in Parliament; RCMP search contractor’s home day before House admonishment NewsBY IREM KOCA
Procurement watchdog to probe ‘bait and switch’ practices across departments amid ArriveCan revelations NewsBY IREM KOCA
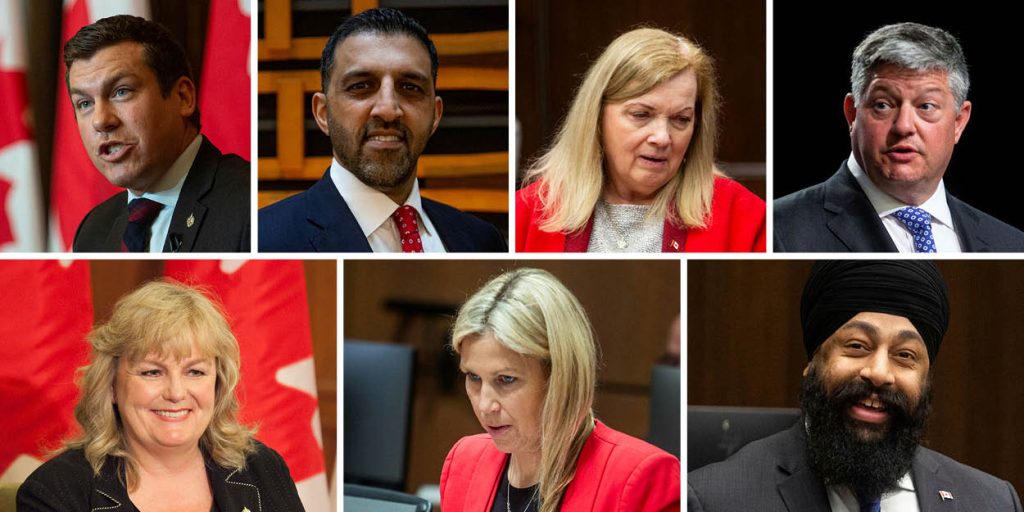
Sponsored travel climbed back to pre-pandemic levels in 2023 as MPs accept trips to Israel, Taiwan, U.K. NewsBY STEPHEN JEFFERY
More evacuation operations for citizens will happen, Ottawa must act now to be prepared OpinionBY ANDREW ERSKINE
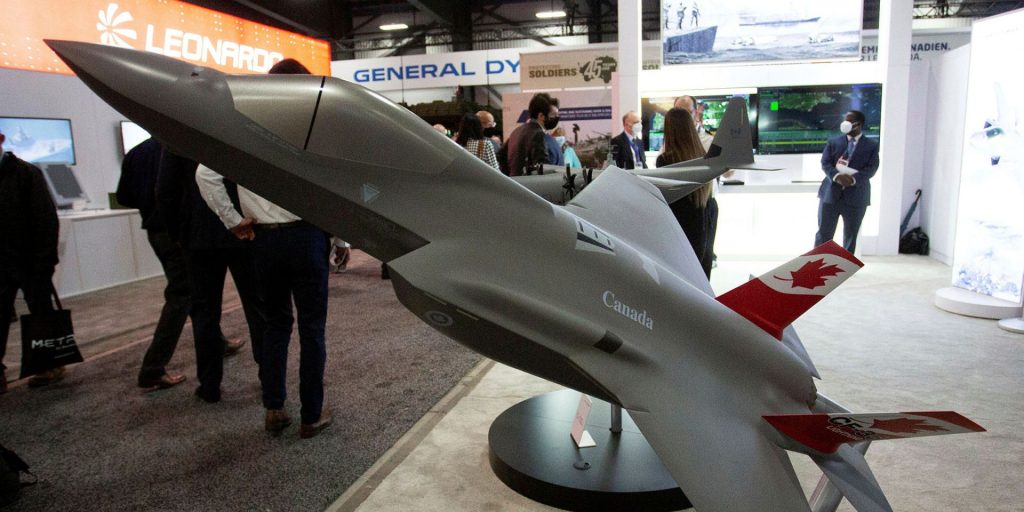
Operational shortcomings, aging equipment, and culture in crisis: new DND report a ‘depressing reading’ of state of military, say MPs NewsBY NEIL MOSS